I’m not sure why, but in the last 24 hours, PureOS has slowed to a crawl. As I write this the output is delayed by a good 3 seconds?
What might be going on? what is the fix? (Rebooting doesn’t seem to fix it.)
I’m not sure why, but in the last 24 hours, PureOS has slowed to a crawl. As I write this the output is delayed by a good 3 seconds?
What might be going on? what is the fix? (Rebooting doesn’t seem to fix it.)
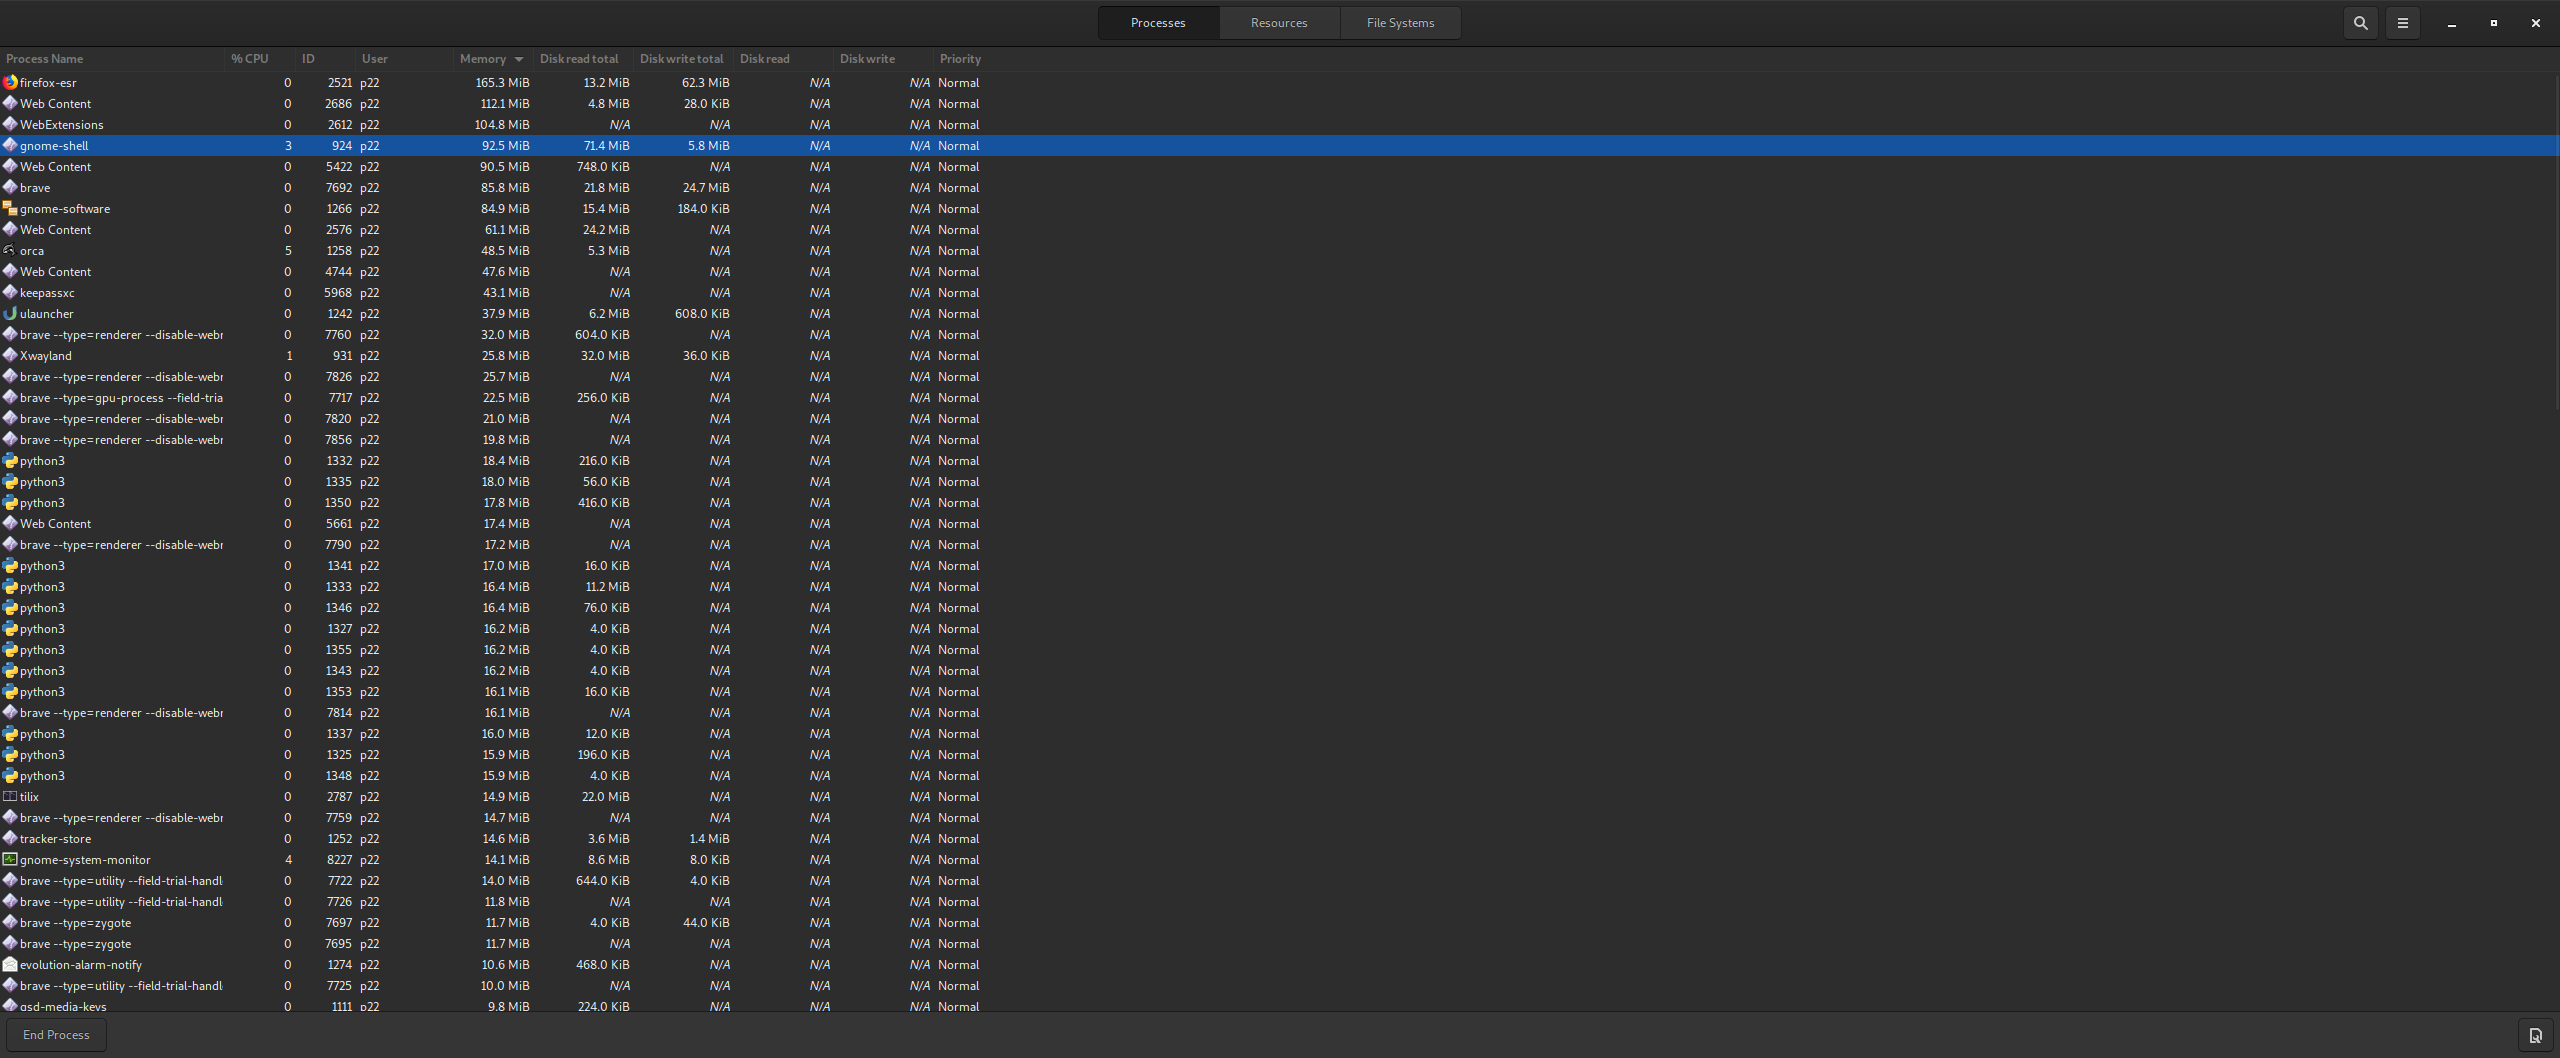
Open system monitor or htop (not sure if those are on PureOS) and see what is hogging the CPU.
Top is brave browser at 154MB… but that isn’t that much is it?
It isn’t really about memory they are using, although that can indicate some problems. You are more interested in the amount of CPU cycles it is hogging.
If it is in fact brave doing all the hogging, check your tabs and see if any of them are doing something intensive.
Do you have any kind of file syncing going on?
I guess you need to find out 
There are tools, that are a good start. You’d need to use them from the terminal (Tilix):
free: shows available memory and more important used swap. Low memory and constant swapping is a good way to make a Linux really slow.top: shows memory and cpu usage and might give a good hint which process(es) are the cause for your problemsiotop: fills an information gap in case of a high load (shown in top). A high load usually means that some process is excessively using I/O (input-output-operations e.g. disk or network)In your terminal (Tilix) you’ll have to type:
someuser@somehost:~$ free
              total        used        free      shared  buff/cache   available
Mem:       16405508     3172540     9302360      740096     3930608    12152712
Swap:      17974048           0    17974048
If Mem: free is very low and Swap: used high you’ll know that your system is missing free ram for what it is doing.
someuser@somehost:~$ top
This gives you an output in table form with regular updates like this:
top - 10:55:50 up  2:28,  1 user,  load average: 0,11, 0,18, 0,24
Tasks: 243 total,   1 running, 242 sleeping,   0 stopped,   0 zombie
%Cpu(s):  2,5 us,  0,8 sy,  0,0 ni, 96,5 id,  0,0 wa,  0,0 hi,  0,2 si,  0,0 st
MiB Mem :  16021,0 total,   9062,7 free,   3116,8 used,   3841,5 buff/cache
MiB Swap:  17552,8 total,  17552,8 free,      0,0 used.  11846,7 avail Mem

  PID USER      PR  NI    VIRT    RES    SHR S  %CPU  %MEM     TIME+ COMMAND
 6121 cvogel    20   0 3143624 253100 138280 S   4,7   1,5   4:00.74 gnome-shell
 5928 cvogel    20   0  498152 223760 194776 S   4,0   1,4   3:26.70 Xorg
1
load average is an indicator (like mentioned above) and the processes listed on top are the ones with the highest cpu usage. You can switch to memory usage by typing an upper M. A lower ‘q’ quits top.
Not sure if iotop is installed by default so you might need to get it first:
someuser@somehost:~$ sudo apt-get install iotop
You can call it using
someuser@somehost:~$ sudo iotop
Here is an example output - it works similar to top:
Total DISK READ:         0.00 B/s | Total DISK WRITE:         0.00 B/s
Current DISK READ:       0.00 B/s | Current DISK WRITE:       0.00 B/s
  TID  PRIO  USER     DISK READ  DISK WRITE  SWAPIN     IO>    COMMAND
    1 be/4 root        0.00 B/s    0.00 B/s  0.00 %  0.00 % init nosplash
    2 be/4 root        0.00 B/s    0.00 B/s  0.00 %  0.00 % [kthreadd]
    3 be/0 root        0.00 B/s    0.00 B/s  0.00 %  0.00 % [rcu_gp]
    4 be/0 root        0.00 B/s    0.00 B/s  0.00 %  0.00 % [rcu_par_gp]
    6 be/0 root        0.00 B/s    0.00 B/s  0.00 %  0.00 % [kworker/0:0H-kblockd]
    8 be/0 root        0.00 B/s    0.00 B/s  0.00 %  0.00 % [mm_percpu_wq]
    9 be/4 root        0.00 B/s    0.00 B/s  0.00 %  0.00 % [ksoftirqd/0]
As you can see my system is not using I/O much :).
These informations should already reveal some hint about what’s going on.
May be useful to see at what frequency is your cpu running:
watch 'cat /proc/cpuinfo | grep MHz'
the first thing I look at when system is slow is cpu wait time in the top output (highlighted)
%Cpu(s): 2,5 us, 0,8 sy, 0,0 ni, 96,5 id, 0,0 wa, 0,0 hi, 0,2 si, 0,0 st
that may indicate spurious interrupts (eg usb bad contact) or IO wait (swap or heavy io-bound process). Spurious interrupts will also raise up hi/si/st metrics. If that is all low, system is idle but load average is high - usually means cpu got stuck at low freq (eg throttling).
I suspected the problem had to do with Brave. Uninstalled brave. The problem persisted. But is now intermittent?
Looking at the processes, makes no sense. No heavy resources used? It comes and goes. And is not isolated to any app.
Any ideas? If all else fails does reinstalling the OS fix it? If so, how do I do that without losing the data on the root drive?
h
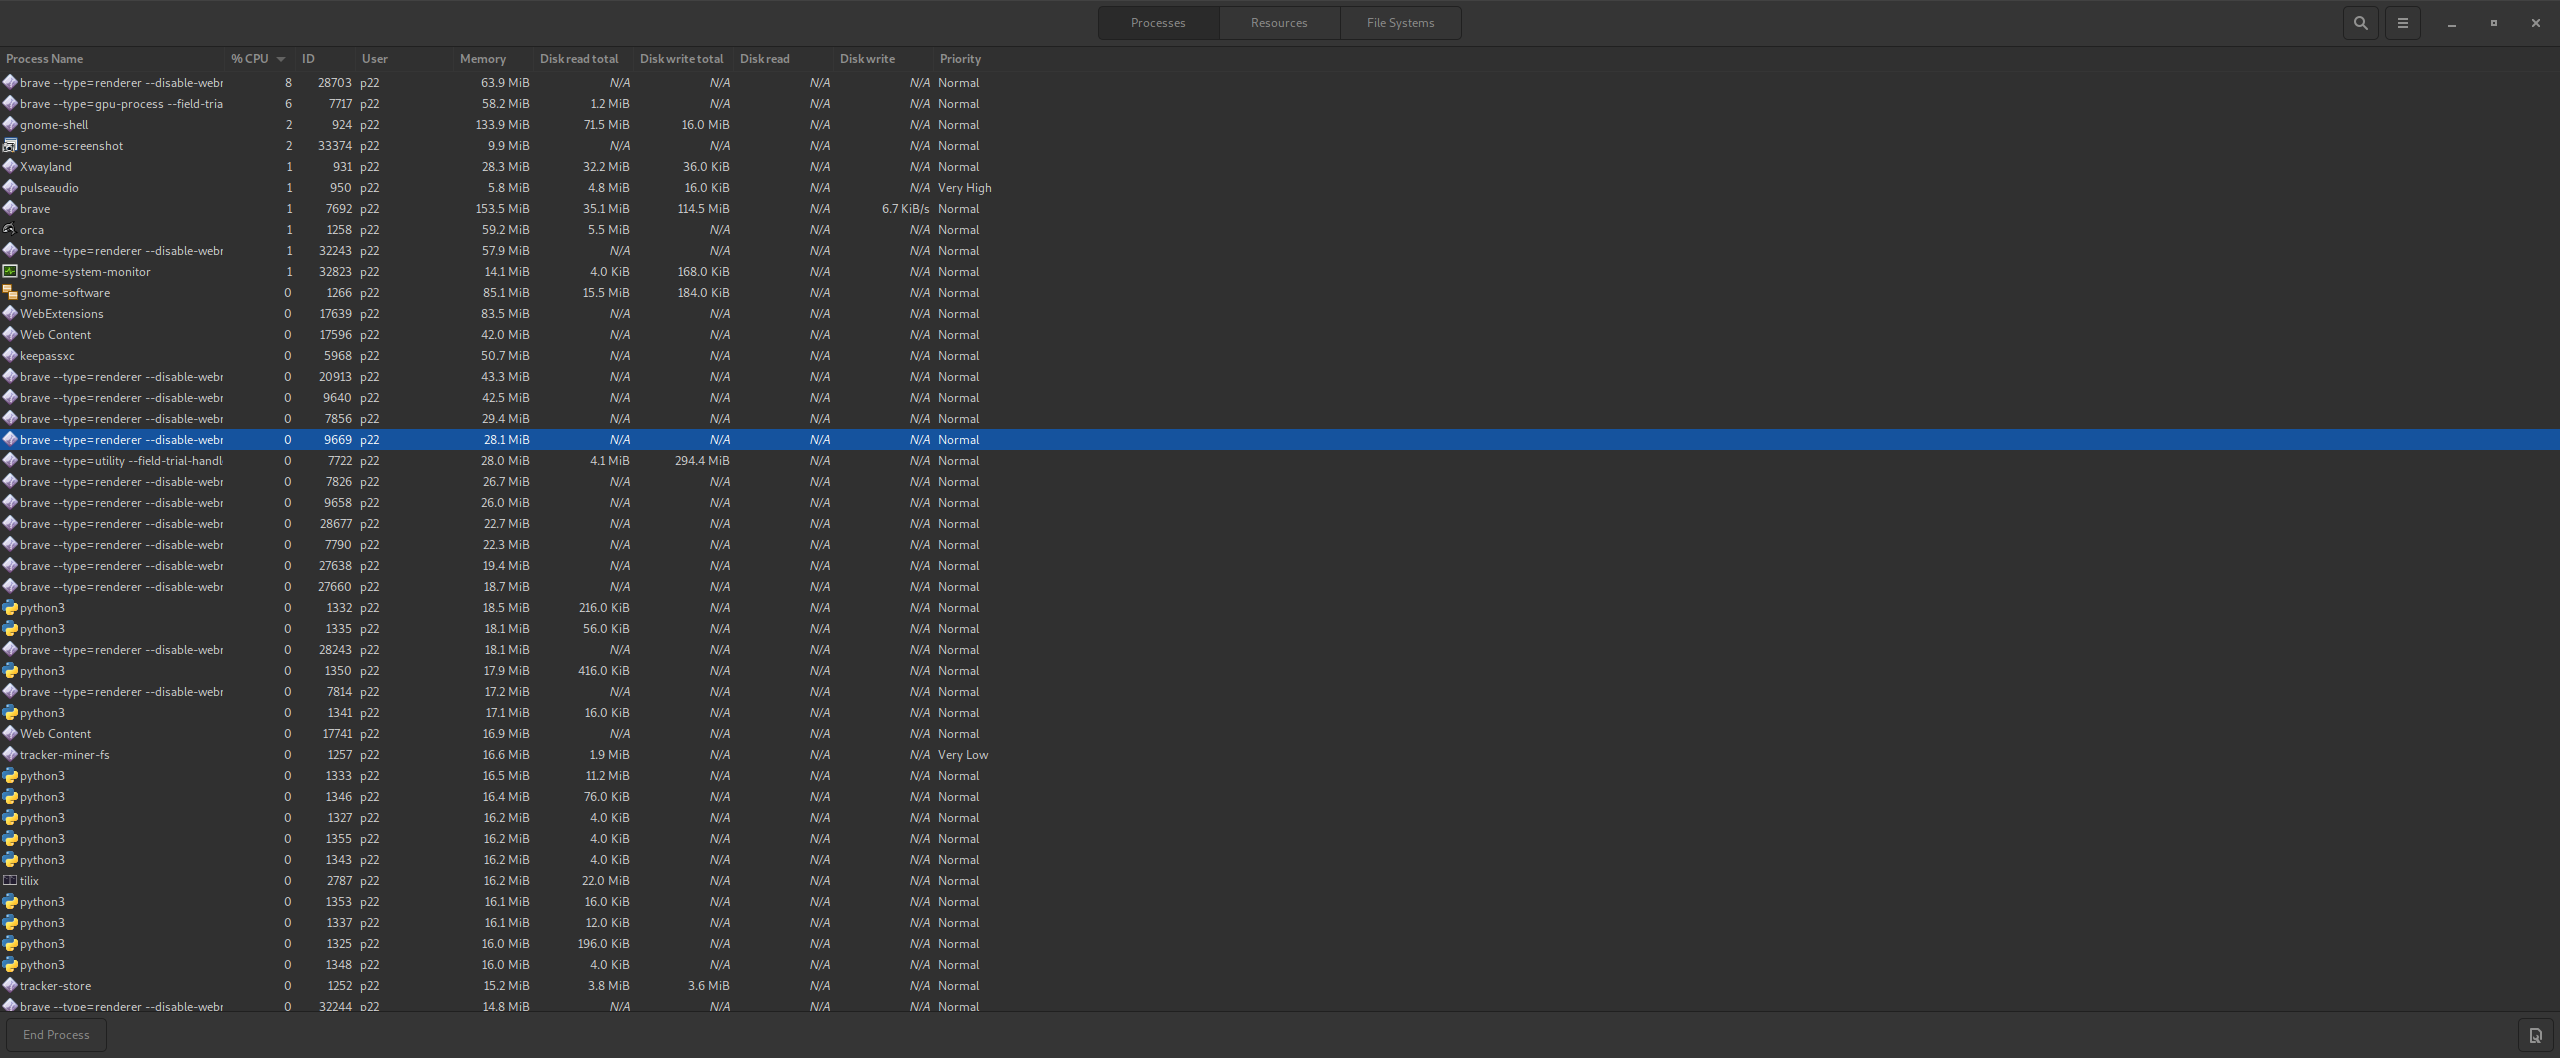
Can you click on the CPU% to sort the list by CPU usage. This is usually an easier way to see what is stressing the system.
As all of your running processes wont fit on the screen at the same time, this is a good way to get every process active to the fore.
It still doesn’t make sense?
(at this point I’m about to do a clean install, and sandbox apps better… how would I do that install without losing data?)
I’d say: You’ll waste your time. Because you’ll run into this situation again and again and you don’t want to install every time a new system. It’s a good time to start learning. Did you look at the tools mentioned above?
What is your system load? What about the values @ruff suggested to check? What about your clockspeed as @mladen asked?
Last time I had this situation it had been a gnome util running wild, because it couldn’t get update information about gnome shell extensions. These things happen and from your writing, you’re the type of person that want to take the responsibility over her system.
Good technicians are here to learn from, keep them entertained  .
.
@Emily Did you check for other potential issues like:
Thanks for all your help. It seemed to have something to do with a brave setting to “keep background apps running when brave closes”.
So far, its fixed after disabling that.
Maybe there’s a reason why Brave is called Brave. 
To be fair, as unpopular as that might be, any Chromium based browser will exhibit the same behavior if the setting is enabled.
This is useful to know, thanks!