I like how the first two graphs together kinda give the min-max of delivery estimates… the max is probably nearing the earth population by fall, so good times for linux phones ahead 
3 Likes
Hi, fun challenge. People, treat it as just that, a fun challenge. We all know that “predictions are very hard, especially when they concern the future!”
With liberally cleaned data to pretend monotonous increasing shipping numbers, and a polynomial trend line, I arrive at:
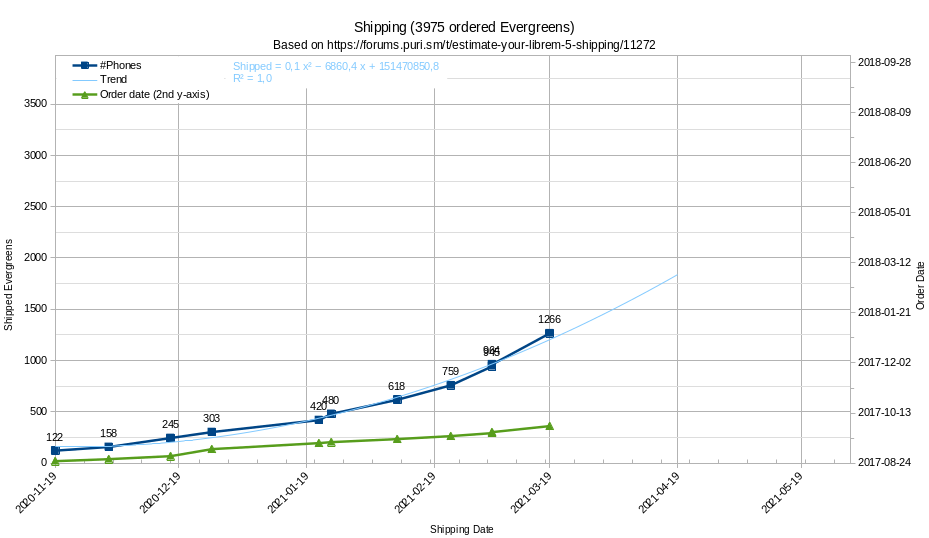
UPDATE: Added a shipping vs Order graph, a diagonal line would mean order/shipping frequency parity.
5 Likes
Probs to you @spaetz. Just great! That’s what I am talking about.
And the idea of putting a second y-axis (order date) to it: Awesome.
Assuming, that from now (last data point) on we have a linear trend. How would it look like?
It seems that we would then hit 2.500 delivered devices by the end of May. As promised. Linear regression would be feasible therefore.
Can you add it?
Not really linear regression, but continueing the trend line would look like that (and extending it any further would finally enter the realm of phantasy :-)):

4 Likes
I would expect some modal changes when the FCC/CE certifications are complete and Byzantium is out.
1 Like
Wouldn’t the production rate saturate at a maximum point and from there is constant as long as the circumstances stay the same?
1 Like
That is what meant here.
Being willing to enter the realm, when would we reach the 3975 phones ordered until 2018-10-05 (end of this thread)? What does your crystal ball speak about this? ![]()
1 Like
i believe that somebody once told me that a sorcerer is a wizard without a hat ? which hat are we talking about here ? 
Don’t forget the 3rd wave corona lock down.  When the new virus arrives china we could have another delay (but don’t hope so).
2 Likes