Hi ![]()
I finally I got the time to get the ftrace event iterator working on the Librem5.
The tool is made with two of my friends and is called TEI (Trace Event Iterator).
The purpose of TEI is that it is possible to record kernel events traced and logged by ftrace.
The raw ftrace data buffer can be saved to a file such that it can be analyzed over and over.
It is possible to record data on the L5 but analyze it on another computer, as long as you have the right “event-header-file”. I’ll come back to that.
It is also possible to make live analysis on the device. (Although I have not tested this yet, but I’ll do that in the following days).
This could (hopefully) be use to catch some spurious bugs, as the “hanging while taking a picture”-bug
My goal is to find out if TEI can be useful to debug bugs like this. So in this thread I’ll use this case to see how TEI can contribute. Hopefully it will at the end be a success. ![]()
But maybe the bug has been fixed before I reach that point, we’ll see. ![]()
Okay, lets get to the technical details:
Generating the event header file:
Ftrace logs all kinds of events found in the /sys/kernel/tracing directory. It is possible to set a lot of filters in this directory and it is also possible to see the (raw-binary) format on a specific event. However, these formats can change form architecture and kernel version etc. so there is no overview or static definition about these formats. So the first step is to use our TEI-event-parser tool to generate the “event header file” which contains a complete overview of all events that the kernel (hence ftrace) can trace in the specific kernel. The output is a header file of pure C-structs for all these events.
Kernel debugging is by default enabled in PureOS on the L5 so I could generate the “event-header-file” I was mentioning with no problem.
For instance the format of the CMA events is here which has been investigated here Draft: Bump CMA memoey (!671) · Merge requests · Librem5 / linux · GitLab
If I understand correct @dcz and @dos?
enum {TEI_EVENTID_cma_release = 528};
typedef struct TEI_Event_cma_release {
	uint16 common_type;
	uint8 common_flags;
	uint8 common_preempt_count;
	int32 common_pid;
	uint32 name;
	uint8 pad0[4];
	uint64 pfn;
	uint64 page;
	uint64 count;
}__attribute__((packed)) TEI_Event_cma_release;

enum {TEI_EVENTID_cma_alloc_start = 527};
typedef struct TEI_Event_cma_alloc_start {
	uint16 common_type;
	uint8 common_flags;
	uint8 common_preempt_count;
	int32 common_pid;
	uint32 name;
	uint8 pad0[4];
	uint64 count;
	uint32 align;
}__attribute__((packed)) TEI_Event_cma_alloc_start;

enum {TEI_EVENTID_cma_alloc_finish = 526};
typedef struct TEI_Event_cma_alloc_finish {
	uint16 common_type;
	uint8 common_flags;
	uint8 common_preempt_count;
	int32 common_pid;
	uint32 name;
	uint8 pad0[4];
	uint64 pfn;
	uint64 page;
	uint64 count;
	uint32 align;
}__attribute__((packed)) TEI_Event_cma_alloc_finish;

enum {TEI_EVENTID_cma_alloc_busy_retry = 525};
typedef struct TEI_Event_cma_alloc_busy_retry {
	uint16 common_type;
	uint8 common_flags;
	uint8 common_preempt_count;
	int32 common_pid;
	uint32 name;
	uint8 pad0[4];
	uint64 pfn;
	uint64 page;
	uint64 count;
	uint32 align;
}__attribute__((packed)) TEI_Event_cma_alloc_busy_retry;
All events will get a TEI_EVENTID and the header file has a complete list of these events:
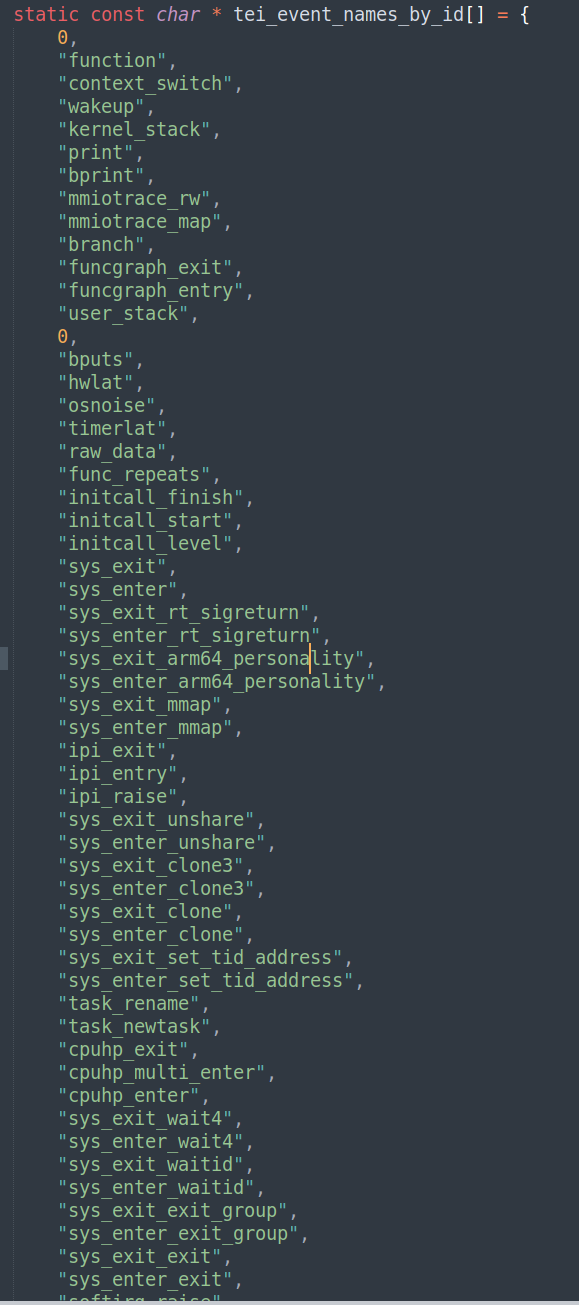
Note the TEI_EVENTID = 5 which correspond to the “print” event. This is the event triggered by “write_trace_marker()” shown in the example below.
The header file is available here, such that you can inspect it yourself:
https://guld-berg.dk/user_content/TEI/event_structs_6.2.0-1-librem5_aarch64.h
Remember the header file will only work for the specific kernel I have right now. When upgrading the kernel a new header file should be generated.
How to trace and record some data:
By placing some few lines of code in a program it is possible to start tracing.
This is a short example program where all traces are enabled, the tracing is started, it is possible to add trace markers which can be spotted in the output (via the “print” event), and they can also be used to customize further analysis and to get a better understanding of the output, by placing meaningful messages. In the end the raw ftrace buffer is saved at the location “/tmp” with “test_data” as file name. In the current TEI-version the file name is append with “_cpu[core number].bin”.
#include "ftrace_tracer.h"
extern Ftrace_Tracer tracer;

int main()
{
	tracer.enable_all_traces();
	tracer.tracing_on(true);
	tracer.write_trace_marker("Save data");
	tracer.save_recorded_data("/tmp/test_data");

	return 0;
}
So running the above program on L5 will output four files in temp folder, one for each CPU core.
(test_data_cpu0.bin, test_data_cpu1.bin, test_data_cpu2.bin, test_data_cpu3.bin).
Analyze the data:
In my test run the entire program did run on CPU core 3 and if I use our simple analyzer template program, I can now parse, iterate and see what went on in the kernel during the program.
[rhodez-x@archlinux TEI]$ ./analyze.program test_data_cpu3.bin
file:[0], timestamp:[4104319599.249000 µs], event:'sys_exit'(23) {0x55abbdda72d4}
file:[0], timestamp:[4104319651.209000 µs], event:'sys_exit_write'(587) {0x55abbdda72f0}
file:[0], timestamp:[4104319704.969000 µs], event:'sys_enter'(24) {0x55abbdda730c}
file:[0], timestamp:[4104319707.609000 µs], event:'sys_enter_write'(588) {0x55abbdda7350}
file:[0], timestamp:[4104319724.169000 µs], event:'print'(5) {0x55abbdda737c}
TRACEMARKER: ('Tracing On
')
file:[0], timestamp:[4104319752.969000 µs], event:'sys_exit'(23) {0x55abbdda739c}
file:[0], timestamp:[4104319756.689000 µs], event:'sys_exit_write'(587) {0x55abbdda73b8}
file:[0], timestamp:[4104319763.169000 µs], event:'sys_enter'(24) {0x55abbdda73d4}
file:[0], timestamp:[4104319767.369000 µs], event:'sys_enter_write'(588) {0x55abbdda7418}
file:[0], timestamp:[4104319771.689000 µs], event:'print'(5) {0x55abbdda7444}
TRACEMARKER: ('Save data
')
file:[0], timestamp:[4104319773.849000 µs], event:'sys_exit'(23) {0x55abbdda7464}
file:[0], timestamp:[4104319776.129000 µs], event:'sys_exit_write'(587) {0x55abbdda7480}
file:[0], timestamp:[4104320091.249000 µs], event:'sys_enter'(24) {0x55abbdda749c}
file:[0], timestamp:[4104320093.409000 µs], event:'sys_enter_write'(588) {0x55abbdda74e0}
file:[0], timestamp:[4104320101.209000 µs], event:'print'(5) {0x55abbdda750c}
TRACEMARKER: ('Tracing Off
')
file:[0], timestamp:[4104320103.009000 µs], event:'sys_exit'(23) {0x55abbdda7530}
file:[0], timestamp:[4104320103.609000 µs], event:'sys_exit_write'(587) {0x55abbdda754c}
file:[0], timestamp:[4104320105.889000 µs], event:'sys_enter'(24) {0x55abbdda7568}
file:[0], timestamp:[4104320106.489000 µs], event:'sys_enter_write'(588) {0x55abbdda75ac}
The example program was a simple program so in this output we can only see how the kernel enters syscalls to write the trace markers, but with a more complex (or longer running) program, we will se a lot of other things happen.
It is possible to set filters on pid, core number and a lot of other things. So it is possible to limit the trace to only relevant info. I’ll try to do an example with millipixels if I can.
The core loop in the analyzer looks like this:
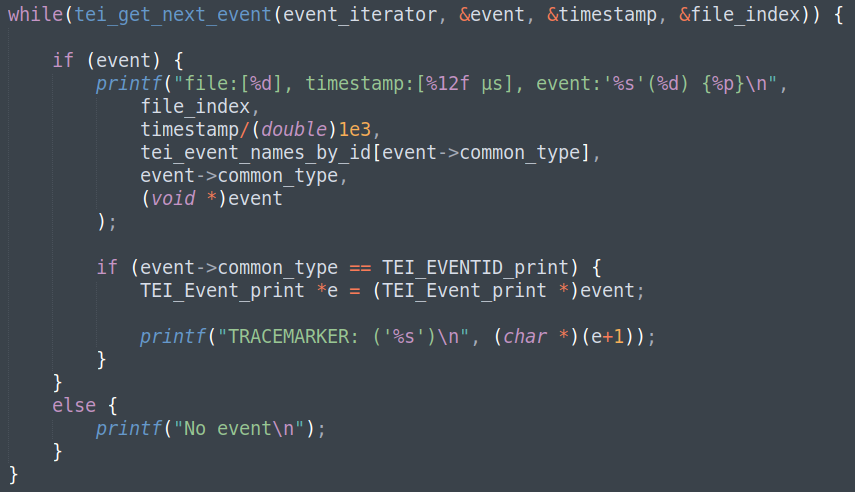
It is possible to loop through all the event and do whatever to analyze the the data.
Count number of events. Look for specific events. Accumulate time within certain events. etc.
Our TEI library is not finish yet and there is some bugs that need to be fixed before we dare to share the code. However I would like to update on the process here.
I’ll hope it turns out useful.
Cheers.
Credits to my friends: https://www.miscellus.com/ (Jakob Kjær-Kammersgaard) and zelaven (Patrick Jakobsen)
