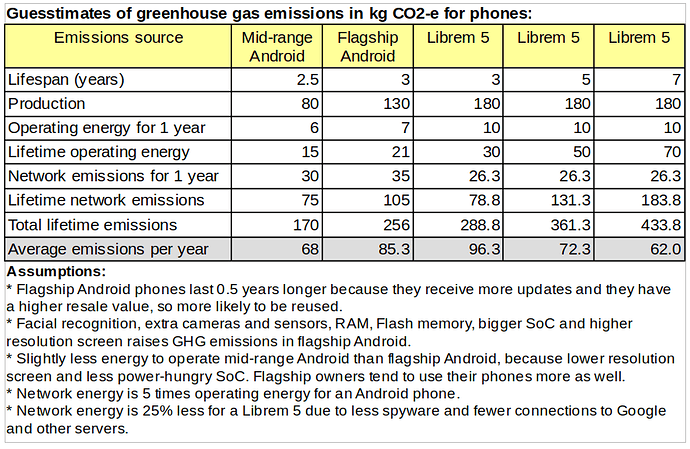
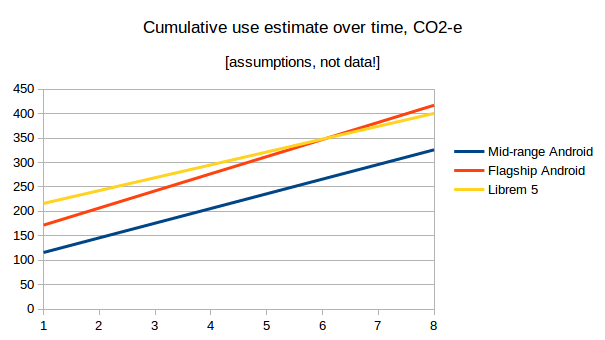
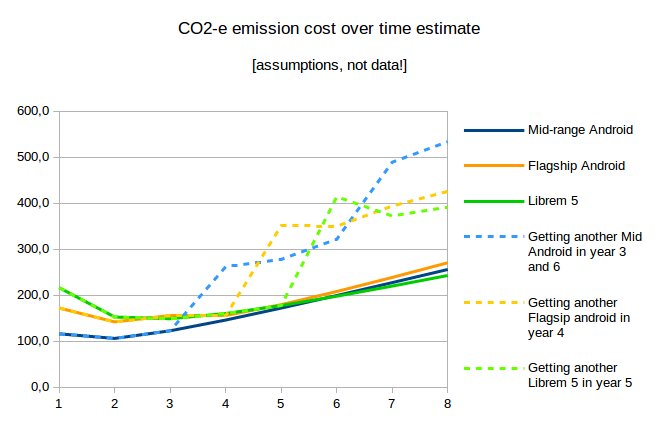
Really cool graphs that you made. I don’t have my spreadsheet file on this PC, but I will upload it when I have a chance.
If you read the scientific literature, you will find huge variations in the estimates of GHG emissions. I think that most studies have underestimated the GHG emissions, because they don’t do a detailed analysis of the materials and processes of IC and LCD production. The best studies were the ones by Eric Williams on DRAM production and a typical desktop PC in 2000 with a Pentium III CPU and 17 inch CRT monitor. Williams looked at some of the chemicals and the processes to purify them for use in a fab, and then looked at economic activity to estimate the rest of the chemicals where he didn’t have information, but his work is very outdated and the energy, water and chemical consumption have fallen, since fabs have gotten a lot more efficient over time and there has been a switch to renewable energy by some of the IC and LCD fabs.
Apple and Fairphone are the only electronics manufacturers who release GHG emission estimates on their devices. The Fairphone estimates are frankly baloney, and clearly don’t account for very much in the manufacturing process. Apple is not transparent at all, but the estimates from Apple used to be reliable in my opinion until the iPhone 6, when Apple realized that its rising emissions would be a PR problem. As smartphones have gotten bigger in screen size and battery size and their cameras and SoC’s have gotten more advanced, their emissions have gotten much higher, but Apple didn’t want to admit this.
Then, Apple embarked on a PR campaign to say that it was switching to 100% renewable energy and it had cut its emissions in half, which was a lot of greenwashing. Most of the emissions for Apple devices happen at its suppliers and assemblers in Asia (Samsung, TSMC, Foxconn, etc.) where most of the energy comes from burning coal and that doesn’t change in a year or two like Apple claimed. However, Apple has been leaning on its suppliers to use more renewable energy, so Apple does deserve some credit, but I still think that Apple is seriously underestimating the emissions for PR reasons.
At any rate, Apple estimates that its iPhone Xs emits 70 kg CO2-e for the 64GB model and 99 kg for the 512GB model (so 0.07 kg per extra GB of Flash memory) and 77 kg for the iPhone Xs Max with 64GB (so 0.38 kg per extra cm2 of screen). For the iPhone Xs 64GB, Apple estimates that 81% of GHG emissions (56.7kg) come from production of the phone, 3% (2.1 kg) from transport, 15% (10.5 kg) from usage for 3 years and 1% (0.7 kg) from recycling. I distrust all of Apple’s current estimates since Apple has turned environmentalism into a PR game, but I find how the emissions were rising up to the iPhone 6 very interesting:
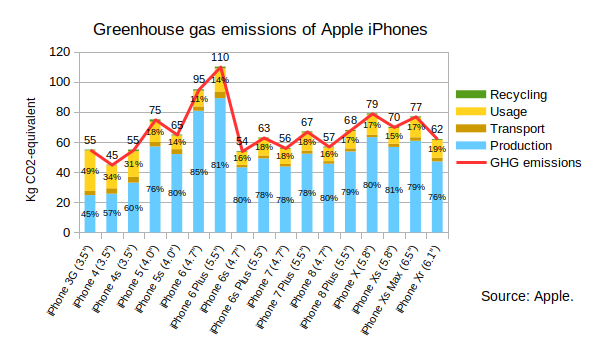
Most of the LCA studies are like Ercan (2013)'s study of the Xperia T (4.55" screen, 139 g), which estimates 70% of GHG emissions (34.5 kg) for production, 10% (5.0 kg) for transportation, 18% (9.5 kg) for usage and 2% (1.0 kg) for end of life. Then, these studies are multiplied by 1.5 billion smartphones per year for annual global smartphone emissions.
I think that these studies are dramatically underestimating the production emissions, because as Williams shows they aren’t capturing all the activities that are needed to produce ICs, LCDs and batteries, so standard process-sum methodology in LCA studies doesn’t work very well for electronics. The amount of energy and resources to purify metals, chemicals, water and air for use in silicon and LCD fabs is enormous and a lot of the chemical purification happens outside the fab, so you can’t just look at the fab operations and you can’t just look at what it takes to produce standard copper to estimate energy and resources to produce the copper used in an IC, since it is much purer. You also have to keep in mind that the average phone screen has grown from 50-60 to 80-100 cm2 in size, and the battery has grown from 2000-2500 to 3000-4000 mAh over the last 5 years and the weight has increased from 120-150 to 170-210 grams. Fabricating components such as camera sensors and digital/image signal processors have a higher environmental impact than they did 5 years ago because the expectations for smartphone quality has risen over time.
For these reasons, I’m estimating 80 kg for a mid-range Android phone and 130 kg for a flagship Android phone, and then adjusting it to 180 kg for the Librem 5, since I guesstimate that it will have 2.5 times more silicon die area and 2 times more circuit board area than the typical phone, and those components form the majority of GHG emissions.
One thing that I know that I got wrong in my previous post is the emissions from operating a smartphone. Even if we assume that the Librem 5 will use 80% of its battery per day, here is what I calculate will be the GHG emissions to charge the Librem 5 for a year:
| GHG emissions to charge the Librem 5 |
|
| Battery (mAh) |
3500 |
| Battery (Wh) (assume 3.8V) |
13.3 |
| 80% battery consumed per day (Wh) |
10.6 |
| “ with 12% DC loss charging battery (Wh) |
12.1 |
| “ with 27% AC-DC adapter loss (Wh) |
16.6 |
| Energy when not charging (W) |
0.02 |
| 22 hours per day when not charging (Wh) |
0.44 |
| Total per day (Wh) |
17.0 |
| “ with 5% transmission line loss (Wh) |
17.9 |
| Yearly AC power (kWh) |
6.5 |
| Yearly kg CO2-e (if 0.6 kg CO2-e / kWh) |
3.9 |
I’m assuming that the Librem 5 uses the same type of battery as the Galaxy On5 which is 3.8V. I was surprised how little energy it takes to charge smartphones, compared to running other things. The average Android phone is probably more energy efficient than the Librem 5 and only uses 60% of its battery per day.
I overestimated the charging energy because today’s fast charging, larger batteries and larger screens have upped the energy consumption. Fast charging is less energy-efficient that slow charging because more of the energy is lost in heat and fast charging generates more resistance in the battery. However, when I do the calculations, I find that the energy to charge smartphones still isn’t that much, even with today’s 15 and 18 watt chargers.
The network energy estimates vary a lot too. Belkhir and Elmeligi (2018) have much higher estimates than Malmodin and Lunden (2018). I tend to think that the real amount is between these two estimates. Malmodin and Lunden seem to consistently underestimate emissions, but Belkhir and Elmeligi don’t seem to be taking into account growing energy efficiency and the switch to renewables in their estimates of network energy.
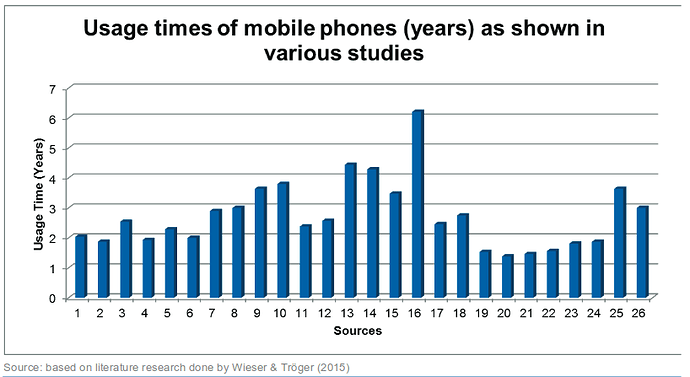
A 5 year lifespan for mobile phones is very different from the average of the reputable studies whose median value is a little over 2 years:
The Consumer Electronics Association survey (since changed their name to the CTA) is poor methodology because people often expect devices to last longer than they do. People don’t expect their phones to break, but a sizable portion get cracked screens, get dropped in liquid, have the battery die, get stolen, etc. or people switch carriers or move and their old phone isn’t compatible. The Yale study also doesn’t take into account that the vast majority of phones never get resold as used phones. In 2017, there were 140 million used smartphones sold in 2017, compared to 1536.5 million new smartphones, so only 9% of smartphones got resold as used (although that percentage is rising). In other words, the Yale study only looks at the 9% of phones that get sold as used, so it is ignoring all the phones that were damaged, were stored or became functionally obsolete. It is mainly focusing on high-end models, such as the iPhone and Galaxy S series, that are more likely to retain their value over time and be resold as used phones, but that isn’t a representative sample of all smartphones.
The most accurate way to measure average lifespans of smartphones in my opinion is the data from Kantar WorldPanel, because it compares annual smartphone sales to the total number of cellular phone subscriptions in each country to determine how often people upgrade their phone:
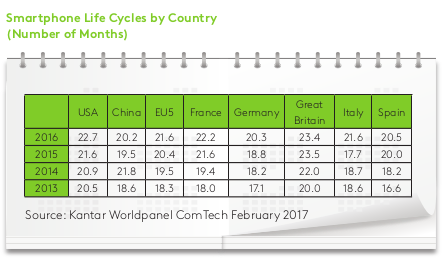
A sizable percentage of phones get damaged. The charge capacity of lithium ion batteries start degrading rapidly after 500 100% depth of discard cycles, and over 90% of current cell phone models do not have replaceable batteries. The majority of old cell phones get stored because the owner buys an newer phone or changes the cellular provider, but keeps the old phone as a backup.
9% of old smartphones will be resold and 11% of mobile phones get recycled, so the majority of old phones are stored and not reused. I have a smartphone from 2011 and a feature phone from 2008 sitting in my desk which still work, but I haven’t used them in years, so I don’t know how I would answer a survey that asked me how long I expect my mobile phone to last. I might say 8 years since my 2011 smartphone still works, but the reality is that I have gotten a new phone every 3 years, which is why we can’t trust the CTA survey results, in my opinion.


