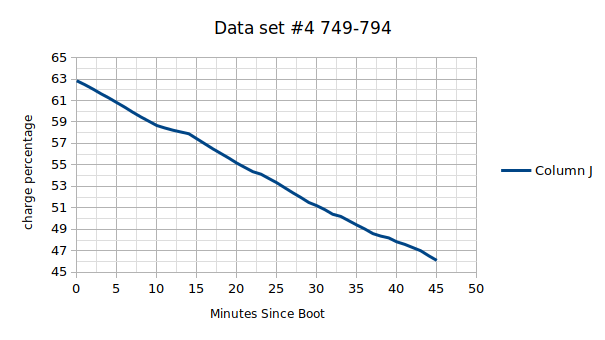
The rest of the data set’s battery vs time can be seen in the same place as the raw data itself. I’ll clear this up a bit as to why my graphs are smoother then yours for the battery data, I’m using the raw battery data in column two, it is in the form of 3,000,000 as 100% and 0 as 0% so to get the raw percentage I divided it by 30000. I also used the Unix time stamp in row three to find the relative time since the start of each set. In set three you can see when I got your request Implemented at 8 minutes in to the boot. Data set four was all active time as it was when I was working on @amosbatto 's request.
Edit: as for the rapid drop in the middle of of set number 3, I’m fairly sure that was me rebooting the phone. The active periods are never that steep. You can see active periods in the sets as flat parts in the first set and, as slight dips in the rest. Set four is the best example of an active period due to the fact I was engaged in running the screen, the wifi, bluetooth for a keyboard, and running fairly intensive programs all at the same time. At no point have I had the baceband on for longer then a few second, and I keep the microphone and camera always off as well.
Ah, that explains it - gaps. It did seem odd without context. Thanks.
I’m thinking up new test protocols, which you may or may not want to do, but would be more thorough:
1A (“idling”) - A “baseline” dataset, with everything on (modems, wireless, BT - but no useage), 100% screen brightness (on all the time), idling: let it go from battery from 100% to 0 (shutdown). Only the data logging script running.
1B (“idling with more realistic screen”) - Same as 1A, but screen at some lesser brightness that looks usable (75-85%?).
2A (“idling securely”) - Same as 1A, but HW killed with switches.
2B (“idling securely with more realistic screen”) - Same as 1B, but HW killed with switches.
3A (“some use”) - Same as 1A, but this time some usage, like a really long youtube video (no screensaver, Firefox)
3B (“some use with more realistic screen”) - Same as 1A, but this time some usage, like a really long youtube video (no screensaver, Firefox)
4A (“actual use in offline/secure mode”) - same as 2A, but this time some usage, like a really long video from memorycard (offline)
4B (“actual use in offline/secure mode with more realistic screen”) - same as 2B, but this time some usage, like a really long video from memorycard (offline)
I think those should give an idea of what to expect from current Dogwood and give context to measure against when future improvements arrive. These, in a matrix, should let us to approximate the effects of the screen (brightness), HW switches (online/offline) and light usage to battery life. Possibly to heat also, if we can bet those measurements too. I’m sure these can be refined - they need to be reproducible and simple, yet still cover the different profiles.
A bit dull to do, I’ll admit, but that’s base data for you. And I’ll understand if it’s a bit too much to ask.
I was thinking the same thing, I’m not sure how I could hold the screen on without use but I can try. I can tell you things seem to be moving very fast.
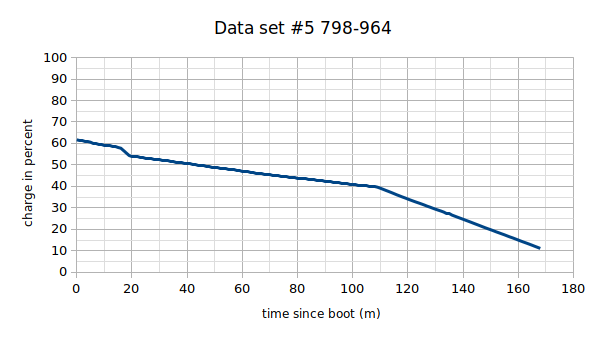
This is the data from my usage tonight, the first dip was it updating to the latest software, the period after that was full idle in lockdown mode, the lowest power drawl you can expect at any given time. The next period where it gets more steep was it in full use with decent load, 100% brightness, all switches on as if I had a carrier, and needed the camrea and mic, active use of the bluetooth (keyboard again) and wifi. (I was using a website based chatting service with my GF and decided to do this to get more data while I did)
For the screen, see: Prevent suspend & keep the screen on or then there is this hack. Or set up a propeller and tape a pencil on the other end of the axle and have that tap the screen…
That heavy-ish 1 hour use with gf seems to have shortened about 1.5 to 2 hours away from the battery, compared to idle.
Also, the phone properly got fairly hot for once during this due to charging and this being fairly intensive at the same time. Still not so hot that it was uncomfortable or anything, this is the hottest I’ve ever had the phone. So, guess it’s not advice able to run a benchmark while charging.
I did a totally unfair comparison with my Thinkpad T450s laptop (2-core/4-thread Core CPU), and the Librem 5 doesn’t do that bad in the comparison, when we consider the differences in power consumption and the cost of the processors.
I ran those same on a couple of years old work laptop (i5 4x2.53Mhz M540 2core/4thread) and it looks even better: 5.59 / 245.3 / 0.9 / 7.62 / 0.38 / 3.24 / 2.92 It’s not the killer of the latest laptops, but the difference is small compared to the weight and volume.
My guess is that @amosbatto’s table shows timings in seconds. In that case smaller is better, and the “Times better” column means how much faster the ThinkPad was compared to the Librem 5 for that particular test.
It would have to be timings in seconds for some rows and work achieved (e.g. hashes performed or bytes encrypted) in fixed amount of time in other rows to make sense to me.
I would run it myself but the program appears to hang on my computer - but that’s another problem …
The results (if you want to run your own tests) and keys are from hardinfo - or in my case the GUI version “System profiler and Benchmark”.
CPU Blowfish: lower number is better
CPU Cryptohash: higher
CPU Fibonacci: lower
CPU N-Queens: lower
CPU Zlib: higher
FPU FFT: lower
FPU: Raytracing: lower
Also, at the end of @dylanlesterpvcs data (and the GUI) there are reference results to compare also (although a bit older CPUs but still).