I’ve been playing around with the following, and I’m still testing, but I’ll share some of the basics I (think I) have learned so far. Corrections and suggestions are welcome.
- vnstat - to display stats in the terminal
The vnstat package creates a table of data stats in the terminal:
sudo apt install vnstat
See vnstat options with the `--longhelp` parameter:
purism@pureos:~$ vnstat --longhelp
vnStat 2.6 by Teemu Toivola <tst at iki dot fi>

Query:
      -q,  --query                 query database
      -s,  --short                 use short output
      -5,  --fiveminutes [limit]   show 5 minutes
      -h,  --hours [limit]         show hours
      -hg, --hoursgraph            show hours graph
      -d,  --days [limit]          show days
      -m,  --months [limit]        show months
      -y,  --years [limit]         show years
      -t,  --top [limit]           show top days
      -b,  --begin <date>          set list begin date
      -e,  --end <date>            set list end date
      --oneline [mode]             show simple parsable format
      --json [mode] [limit]        show database in json format
      --xml [mode] [limit]         show database in xml format

Modify:
      --add                        add interface to database
      --remove                     remove interface from database
      --rename <name>              rename interface in database
      --setalias <alias>           set alias for interface

Misc:
      -i,  --iface <interface>     select interface
      -?,  --help                  show short help
      -D,  --debug                 show some additional debug information
      -v,  --version               show version
      -tr, --traffic [time]        calculate traffic
      -l,  --live [mode]           show transfer rate in real time
      -ru, --rateunit [mode]       swap configured rate unit
      --limit <limit>              set output entry limit
      --style <mode>               select output style (0-4)
      --iflist                     show list of available interfaces
      --dbdir <directory>          select database directory
      --locale <locale>            set locale
      --config <config file>       select config file
      --showconfig                 dump config file with current settings
      --longhelp                   show this help

See also "man vnstat" for longer descriptions of each option.
SOME BASIC USAGE
Designate an interface.
To track mobile data usage, add its interface name to vnstat.
To find the interface name for the mobile data connection:
Method 1: Run the command ip address in the terminal. You’ll see entries for lo, usb0, wlan0, and wwan0. Observe the listed IP addresses; it should be obvious which one is the mobile connection: wwan0.
Method 2: Open the What IP app (package name “whatip”) when you have WiFi and Cellular both enabled. Again: it’s wwan0.
The command to add the wwan0 interface is: vnstat -i wwan0
Running the basic command vnstat in terminal generates a table (for the day) of all the current interfaces:
purism@pureos:~$ vnstat

                      rx      /      tx      /     total    /   estimated
 usb0: Not enough data available yet.
 wlan0:
       2025-06     20.53 MiB  /    2.32 MiB  /   22.85 MiB  /   37.08 MiB
         today     20.53 MiB  /    2.32 MiB  /   22.85 MiB  /   52.64 MiB

 wwan0:
       2025-06      3.28 MiB  /  163.14 KiB  /    3.44 MiB  /    4.94 MiB
         today      3.28 MiB  /  163.14 KiB  /    3.44 MiB  /    7.92 MiB

purism@pureos:~$
We can further refine the output by adding a parameter, e.g. hours, days, months, or live:
vnstat -h
vnstat -d
vnstat -m
vnstat -l
Example:
purism@pureos:~$ vnstat -m

 wlan0  /  monthly

        month        rx      |     tx      |    total    |   avg. rate
     ------------------------+-------------+-------------+---------------
       2025-06     20.53 MiB |    2.32 MiB |   22.85 MiB |      127 bit/s
     ------------------------+-------------+-------------+---------------
     estimated     34.61 MiB |    2.47 MiB |   37.08 MiB |
purism@pureos:~$
To display mobile data stats for the month:
vnstat -i wwan0 -m
To display lan data stats for the month:
vnstat -i wlan0 -m
For a specific date range (begin & end):
vnstat -i wwan0 -b YYYY-MM-DD -e YYYY-MM-DD
To display the combined lan and mobile data usage for a month:
vnstat -i wlan0+wwan0 -m
To edit the configuration file: sudo nano /etc/vnstat.conf
This setting in the configuration file allows you to set the rotate date:
# on which day should months change
MonthRotate 1
MonthRotateAffectsYears 0
To just view the present configuration: vnstat --showconfig
===
- vnstati - to output a graphical version of the stats
This outputs the vnstat data to a .png file as a nice graphic:
sudo apt install vnstati
See vnstati options:
vnStat image output 2.6 by Teemu Toivola <tst at iki dot fi>

      -5,  --fiveminutes [limit]   output 5 minutes
      -h,  --hours [limit]         output hours
      -hg, --hoursgraph            output hours graph
      -d,  --days [limit]          output days
      -m,  --months [limit]        output months
      -y,  --years [limit]         output years
      -t,  --top [limit]           output top days
      -s,  --summary               output summary
      -hs, --hsummary              output horizontal summary with hours
      -vs, --vsummary              output vertical summary with hours
      -nh, --noheader              remove header from output
      -ne, --noedge                remove edge from output
      -nl, --nolegend              remove legend from output
      -ru, --rateunit [mode]       swap configured rate unit
      -o,  --output <file>         select output filename
      -c,  --cache <minutes>       update output only when too old
      -i,  --iface <interface>     select interface
      -b,  --begin <date>          set list begin date
      -e,  --end <date>            set list end date
      -?,  --help                  this help
      -D,  --debug                 show some additional debug information
      -v,  --version               show version
      --limit <limit>              set list entry limit
      --dbdir <directory>          select database directory
      --style <mode>               select output style (0-3)
      --locale <locale>            set locale
      --config <config file>       select config file
      --altdate                    use alternative date location
      --headertext <text>          specify header text string
      --transparent [enabled]      toggle background transparency

See also "man vnstati".
USAGE
These commands place the graphic in your home folder, but you can designate a different directory and name:
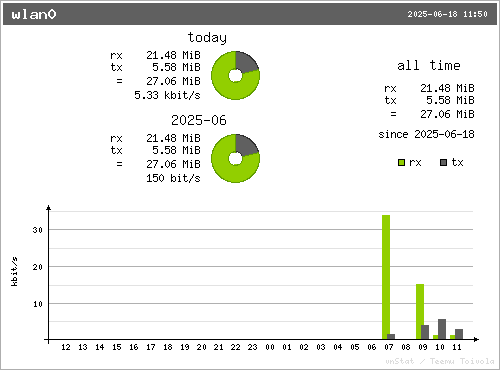
vnstati -i wlan0 -m -vs -o DataUsageWLAN0.png
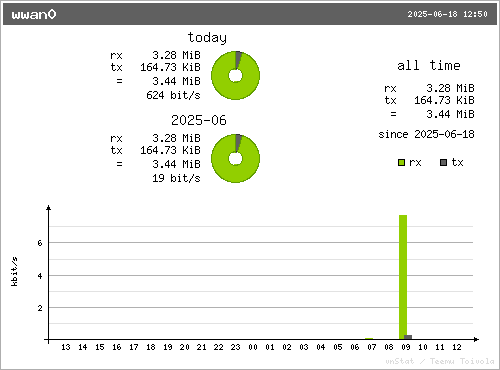
vnstati -i wwan0 -m -vs -o DataUsageWWAN0.png
RESULT
wlan0 (wifi data)
wwan0 (mobile data)
===
You can create a desktop launcher if you want to automatically generate and open the image file with a single tap from the app grid.
===
References:
https://www.howtoforge.com/tutorial/vnstat-network-monitoring-ubuntu/
https://www.cyberciti.biz/faq/linux-unix-adding-network-interface-to-vnstat-to-database-for-monitoring/
EDIT / Additonal reference:
https://www.geeksforgeeks.org/linux-unix/vnstat-command-in-linux-with-examples/